Charting Fold Equity Thresholds in Short-Stacked Tournament Play Across Multiple Poker Formats
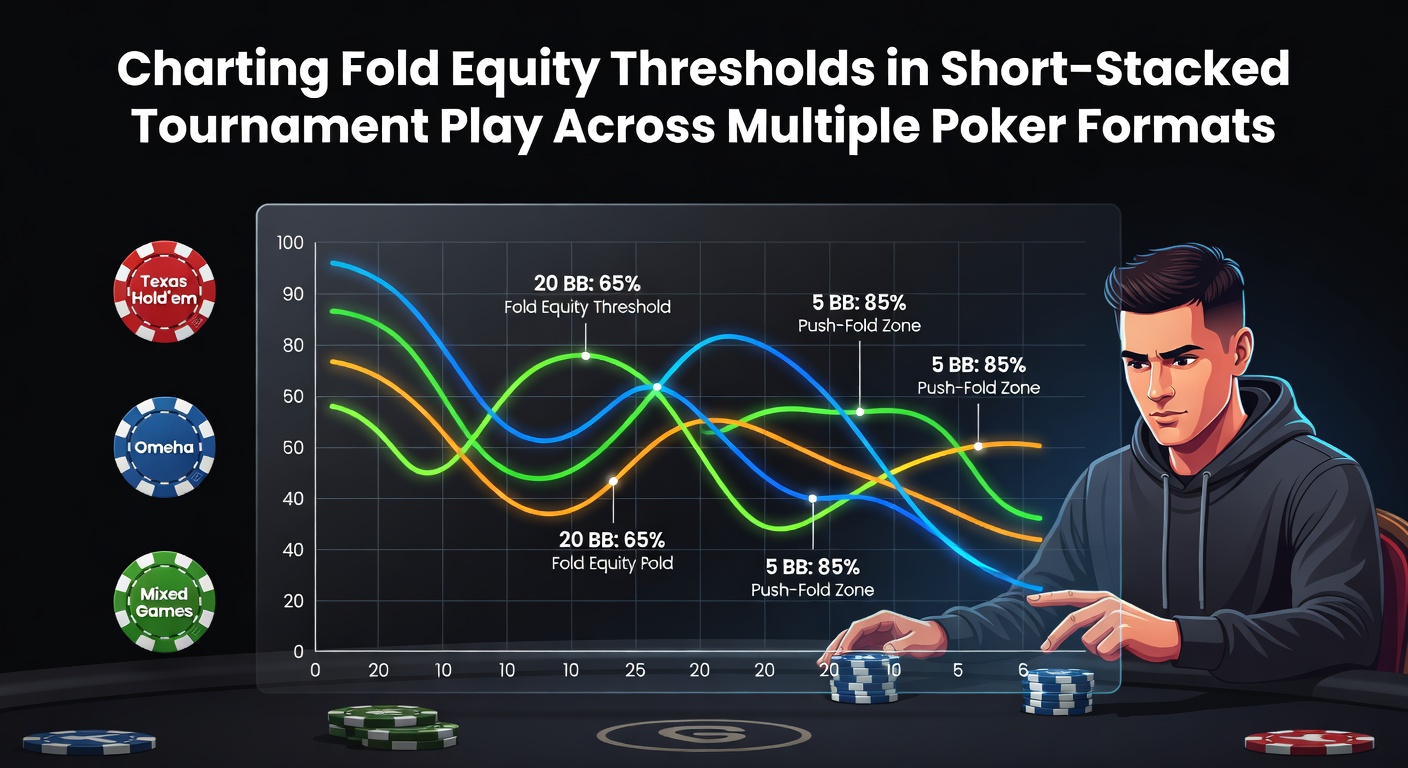
Short-stacked tournament play demands precise calculations around fold equity thresholds because players often hold fewer than twenty big blinds and face decisions that hinge on whether opponents will surrender pots without showdown. Fold equity represents the portion of expected value derived from forcing folds rather than winning at showdown, and charting these thresholds requires mapping stack depths against position, opponent tendencies, and payout structures across formats such as no-limit hold'em multi-table tournaments, pot-limit Omaha, and mixed-game rotations.
Researchers who model these scenarios note that fold equity rises sharply once stacks drop below fifteen big blinds in hold'em events because opening ranges tighten and three-bet frequencies adjust to protect remaining chips. Data from large-scale hand databases show that players who push all-in from the button with ten big blinds or fewer capture fold equity percentages that climb above forty percent against typical defending ranges in the big blind. These figures shift when formats incorporate pot-limit betting because the larger pot sizes inflate the cost of calling and therefore expand the fold equity available to short stacks who apply pressure on earlier streets.
Mapping Thresholds by Stack Depth and Format
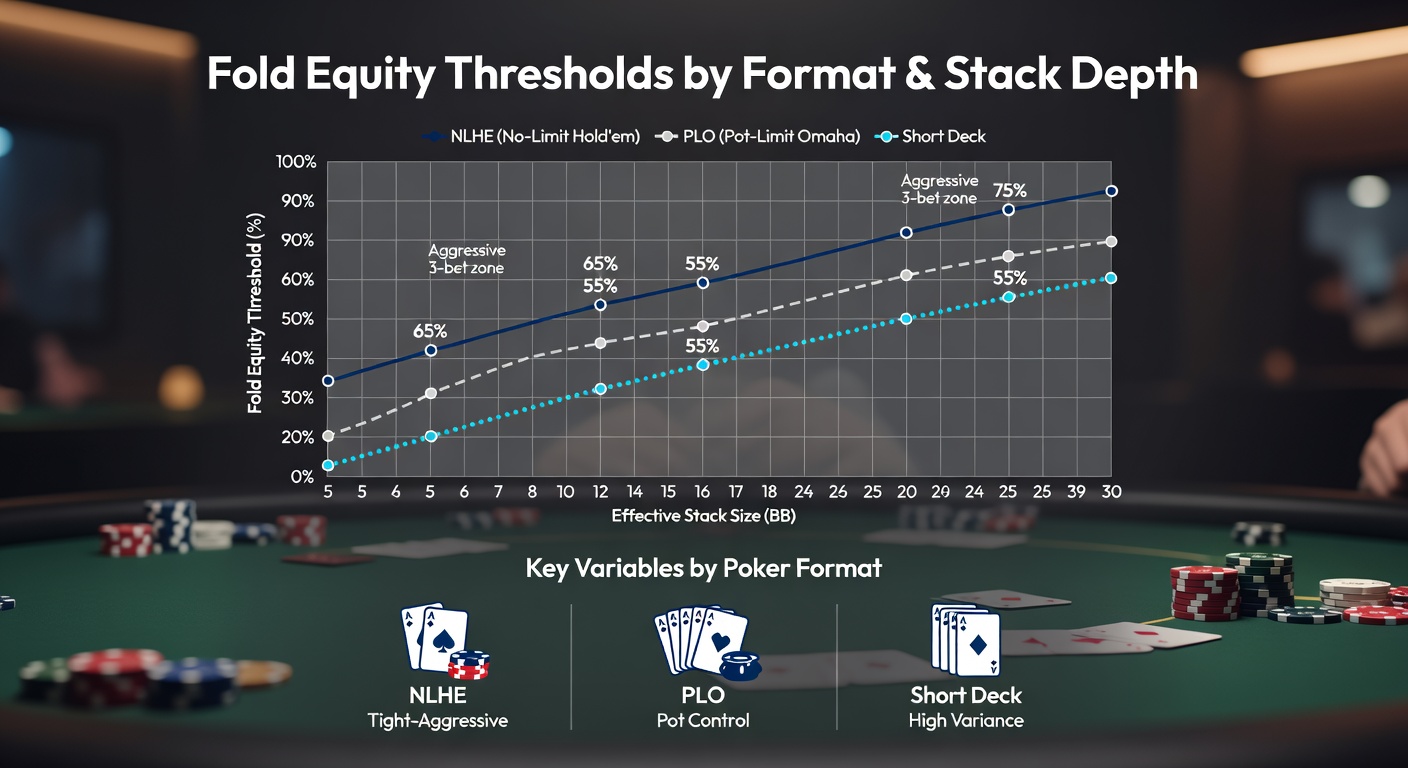
Threshold charts typically divide stack sizes into zones that begin at twenty big blinds and descend in two-blind increments down to five big blinds. Within each zone observers record the minimum fold frequency required to justify an all-in shove from various positions. In no-limit hold'em MTTs the button zone at twelve big blinds often demands only thirty-five percent folds to break even, whereas the same stack in the cutoff requires closer to forty-two percent folds because the presence of additional players behind reduces the likelihood that everyone will release. Pot-limit Omaha introduces wider calling ranges overall, which lowers the fold equity threshold yet simultaneously increases variance because made hands tend to hold more equity when called.
Studies tracking tournament results across 2025 and into May 2026 indicate that mixed-game formats such as HORSE or eight-game rotations produce different inflection points because limit betting rounds cap the size of raises and therefore compress fold equity on early streets. Short stacks in these games find their all-in decisions concentrated in stud and razz variants where the absence of community cards changes how opponents assess drawing potential. Tournament directors scheduling series in Las Vegas for May 2026 have incorporated additional mixed-game events precisely to test how players adjust these thresholds under evolving structures.
Position, Opponent Modeling, and ICM Pressure
Position multiplies fold equity because later seats observe more action before committing. Data aggregated from major online platforms reveal that cutoff shoves at fifteen big blinds generate roughly eight percent more fold equity than hijack shoves against identical stack distributions. Opponent modeling further refines these numbers when players face recreational fields that defend too wide or professional tables that defend with precise ranges derived from solver output. Independent Chip Model pressure intensifies near pay jumps and alters the effective fold equity because survival carries additional value beyond raw chip accumulation.
One documented case from a European series showed a short-stacked player in a pot-limit Omaha event correctly identifying a fold equity threshold of thirty-eight percent at nine big blinds on the button, resulting in a successful shove that eliminated two opponents and propelled the stack into contention for the final table. Such outcomes illustrate how charts serve as decision frameworks rather than rigid rules, requiring real-time adjustment for table dynamics and remaining player counts.
Practical Application and Software Integration
Modern players integrate pre-built threshold charts into heads-up display software and standalone ICM calculators to receive instant feedback during play. These tools output color-coded recommendations that highlight when a shove captures positive expected value based on estimated fold frequencies. Tournament participants preparing for the 2026 schedule have begun cross-referencing multiple formats within single study sessions to build intuition for how hold'em thresholds diverge from Omaha and mixed-game equivalents under comparable stack depths.
Industry reports compiled by gaming research groups across North America and Australia confirm that training regimens incorporating repeated threshold drills correlate with improved survival rates in the middle stages of large-field events. The same reports document that players who neglect format-specific adjustments experience measurable declines in return on investment when transitioning between no-limit and pot-limit structures within the same festival.
Conclusion
Charting fold equity thresholds supplies a structured method for navigating short-stacked decisions across hold'em, Omaha, and mixed formats by quantifying the fold frequencies necessary to justify aggressive lines at each stack depth. As tournament calendars advance through 2026, continued collection of hand data and refinement of modeling techniques will sharpen these charts further, enabling participants to make informed choices that align with both mathematical expectations and the specific demands of each poker variant.